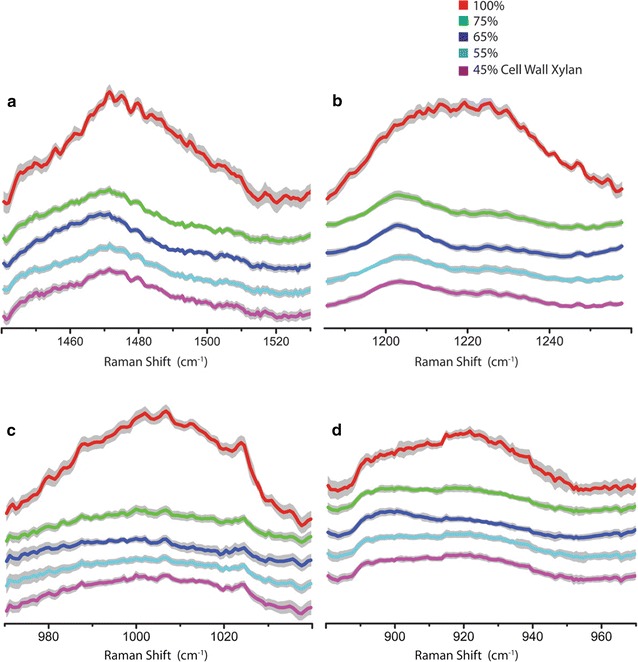
Fig. 4.

Zoom-in comparisons of the xylan-specific Raman bands with varying amounts of xylan content due to controlled xylanase digestion of xylan. a 1471 cm−1 (xylan OH and CH2), b 1219 cm−1 (xylan C-O str, δ(CH), δ(COH)), c 1007 cm−1 (xylan ν(C–C) and ν(C–OH)) and d 920 cm−1 (xylan COC str coupled with CC ring str) in deacetylated corn stover cell wall with varying amounts of xylan content due to controlled xylanase digestion of xylan. The gray traces indicate the standard deviations. All spectrums are normalized
