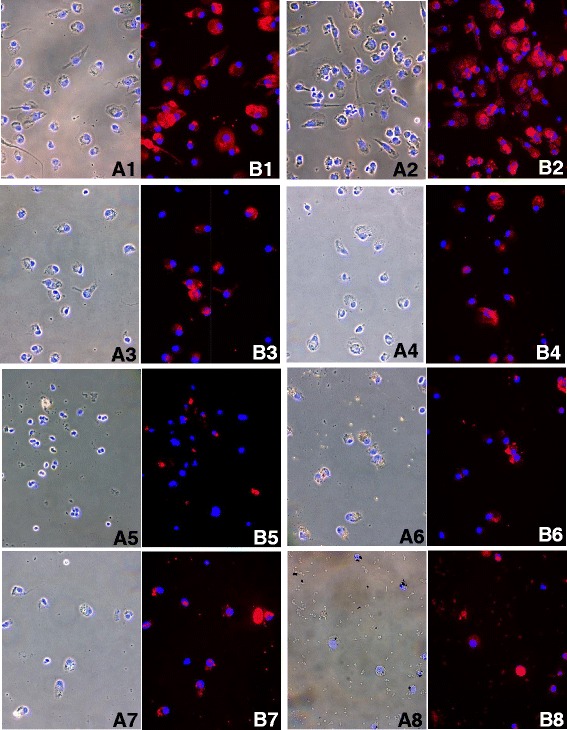
Fig. 3.

Phase-contrast microscopy. Representative images of cells stimulated by different metals (0.1 mM). Panels a and b represent phase contrast (A1→A8) and fluorescent images (B1→B8), overlapped with counterstained nuclei. (A1-B1: untreated cells; A2-B2: Ti; A3-B3: Co; A4-B4: Mo; A5-B5: NiCl2; A6-B6: Ni; A7-B7: CrCl3; A8-B8: Cr-treated samples. (Phalloidin TRITC-conjugate and Hoechst 33258). (1-3; 5-7 = 40× original magnification), (4; 8 = 63× original magnification)
