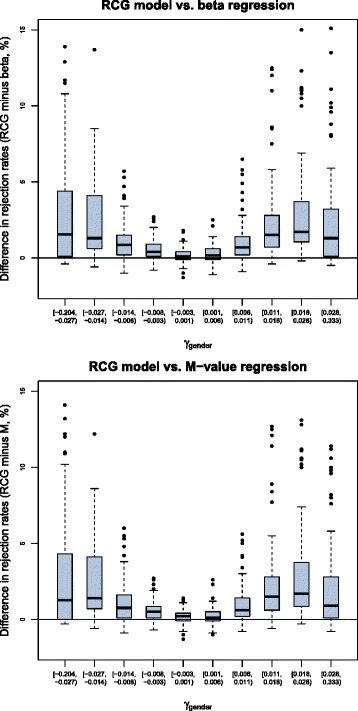
Fig. 4.

Results obtained from the third part of the simulation study. The boxplots contain the differences in the estimated rejection rates of the null hypothesis “ H 0:γ gender=0”, as obtained from the RCG model, beta regression, and M-value regression. The grouping on the x-axes refers to the deciles of the effect γ gender at 1,000 randomly selected CpG sites. The covariate values of the HNR Study (n= 1,118) were used to generate the linear predictors X ⊤ γ. Beta values were generated from the distribution of the ratio in (9). The estimated power of the RCG model was 0.053 in the interval [−0.003,0.001], indicating that the RCG-based type I error rates were close to the nominal level of significance
