
Fig. 5.
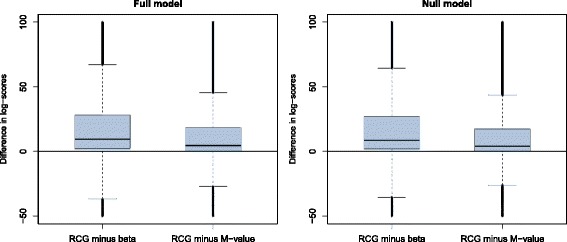
First part of the analysis of the HNR Study data. The boxplots show the average log-score differences obtained from beta regression, M-value regression and the RCG model. The left panel refers to the full models with five covariates, whereas the right panel refers to the covariate-free null models. At each of the 429,750 CpG sites, models were fitted to ten randomly sampled learning data sets of size n=750 each. Log-scores were calculated by evaluating the model fits on the respective independent test data sets (n=368). The boxplots refer to the 429,750 averages of the ten log-score differences