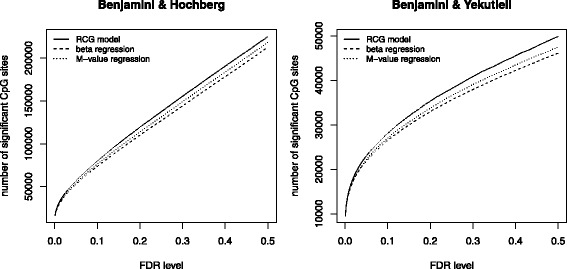
Fig. 6.

Second part of the analysis of the HNR Study data. The figure contains the number of “significant” associations between methylation status and gender, as obtained from beta regression, M-value regression and the RCG model at various levels of FDR control. P-values refer to the test of the hypotheses “ H 0:γ gender=0 vs. H 1:γ gender≠0” in the full model with all five covariates. The procedures by Benjamini & Hochberg and Benjamini & Yekutieli were used to correct the P-values for multiple comparisons. Note the different ranges of the y-axes
