
Fig. 1.
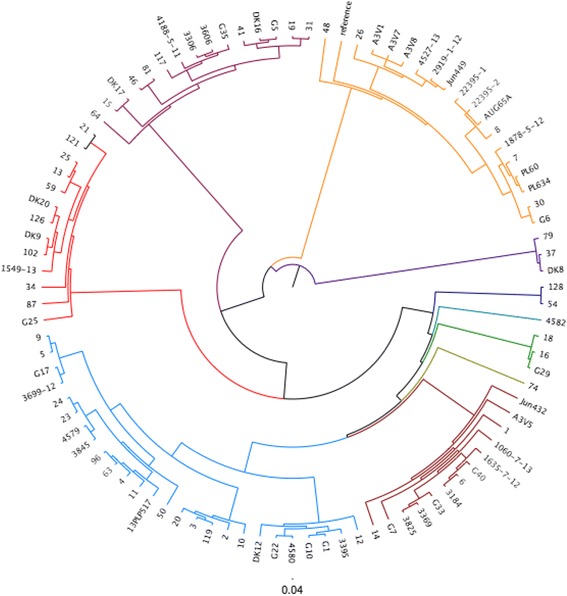
Cladogram based on the 22 virulence factors analysed using multiplex PCRs. Based on this analysis nine main groups were identified and are highlighted in different colours. The branches of the tree are proportional to the distance between the strains. Legend: group 1 = dark green, group 2 = yellow, group3 = blue, group 4 = light green, group 5 = red, group 6 = dark yellow, group 7 = turquoise group 8 = dark blue, group 9 = dark red