Fig. 4.

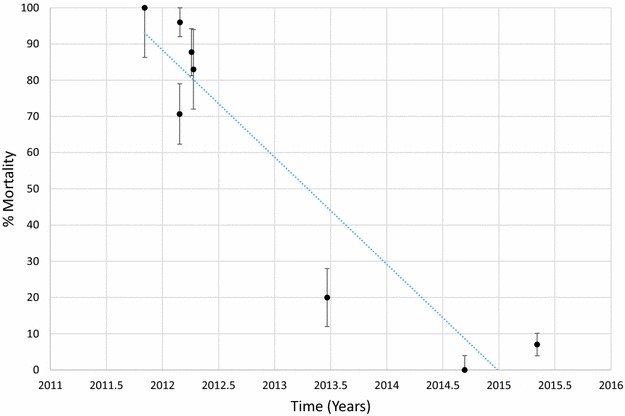
Mortality of An. funestus exposed to propoxur over time. Each point denotes the mortality for a single population with 95% confidence limits. The X-axis represents time expressed as the year plus the day of the year divided by 365.25

Mortality of An. funestus exposed to propoxur over time. Each point denotes the mortality for a single population with 95% confidence limits. The X-axis represents time expressed as the year plus the day of the year divided by 365.25