
Fig. 1.
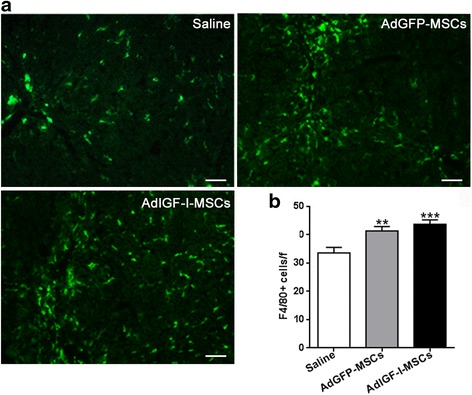
Incidence of macrophages in fibrotic liver tissue after MSC treatments. a Representative microphotographs of liver sections stained for F4/80, at 1 day after saline, AdGFP-MSCs or AdIGF-I-MSCs administration. b Quantitative graph of F4/80-positive cells in liver sections. Bars represent the average of positive cells/field ± SEM from ten representative visual fields. ANOVA Tukey’s post-test, ** p < 0.01 and *** p < 0.001 vs. saline-treated mice