
Fig. 4.
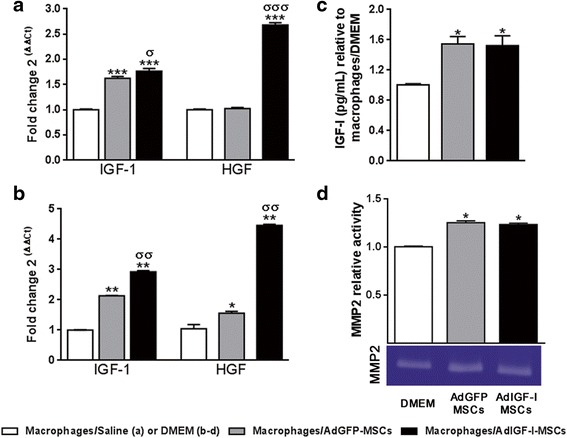
Increased growth factors levels and MMP2 activity in hepatic macrophages after MSCs treatment. Quantitative analyses of IGF-I and HGF mRNA expression levels in macrophages, on in vivo (a) or in vitro (b) experiments, after saline/DMEM (white bars), AdGFP-MSCs (gray) or AdIGF-I-MSCs (black) pretreatments. c IGF-I protein levels in hMø supernatants on in vitro experiments. Macrophages obtained from fibrotic livers were preincubated with conditioned media on in vitro studies. ANOVA Tukey’s post-test, * p < 0.05; ** p < 0.01 and *** p < 0.001 vs. macrophages/saline (in vivo) or macrophages/DMEM (in vitro); σ p < 0.05, σσ p < 0.01 and σσσ p < 0.001 vs macrophages/AdGFP-MSCs conditions. d MMP-2 activity in hMø supernatants after in vitro incubation evaluated by zymography. One representative zymogram is shown. Band intensity of three independent experiments was detected by densitometric evaluation and plotted as MMP-2 relative activity of DMEM/macrophages condition. Dunn’s multiple comparisons test, * p < 0.05 and ** p < 0.01 macrophages/DMEM