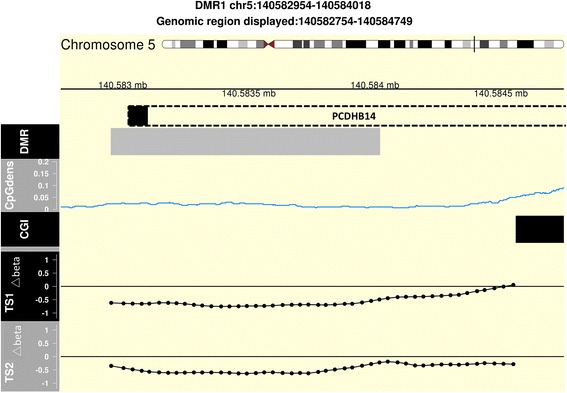
Fig. 3.

DMR1, from TS1 after cell proportion correction, at the promoter region of PCDHB14 (chr5 140582954–140584018). DMR denotes the DMR location (grey box); CpGdens denotes CpG density as computed by CHARM [27] (CpG); CGI denotes the location of CpG islands (black box). TS1 Δbeta and TS2 Δbeta shows the smoothed linear slope (differences in methylation or delta) associated with ACPA-positive healthy and ACPA-positive RA twin, respectively, in the linear model which is used CHARM [27] to identify DMR candidates. Every point denotes a probe location. The location of the gene PCDHB14 is shown in a dotted box; the black square on the left denotes the location of the transcription start site
