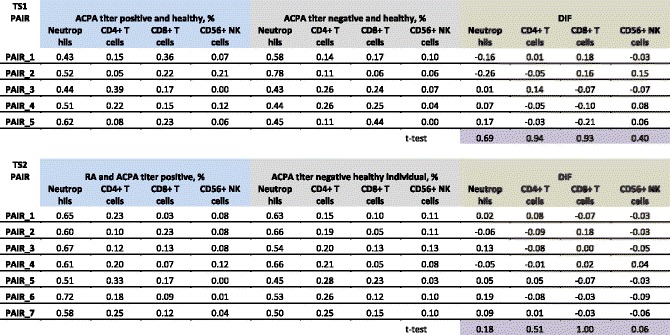
Table 2.
Estimation of cell proportion

For each sample the estimation of neutrophils, CD4+ T cells, CD8+ T cells, and CD56+ NK cells is provided, as described by Houseman et al. [31]. For each twin pair the difference in cell proportion (computed in ratios from 0 to 1, equivalent to percentages) for each cell type was computed in DIF; the purple cells indicate the p values from the paired t-test comparing differences. The sum of all ratios for a sample may differ from 1 due to rounding in the table; the analysis was performed without rounding
