
Fig. 1.
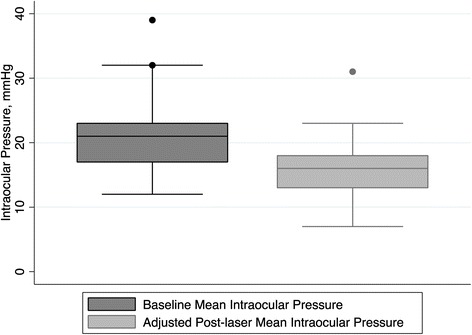
Box plots showing for adjusted success rate, the mean intraocular pressure at baseline and last follow-up visit. * Box represents median and interquartile range. Whiskers correspond to maximum and minimum 1.5 interquartile range (IQR)
Official websites use .gov
A
.gov website belongs to an official
government organization in the United States.
Secure .gov websites use HTTPS
A lock (
) or https:// means you've safely
connected to the .gov website. Share sensitive
information only on official, secure websites.
Box plots showing for adjusted success rate, the mean intraocular pressure at baseline and last follow-up visit. * Box represents median and interquartile range. Whiskers correspond to maximum and minimum 1.5 interquartile range (IQR)