
Fig. 2.
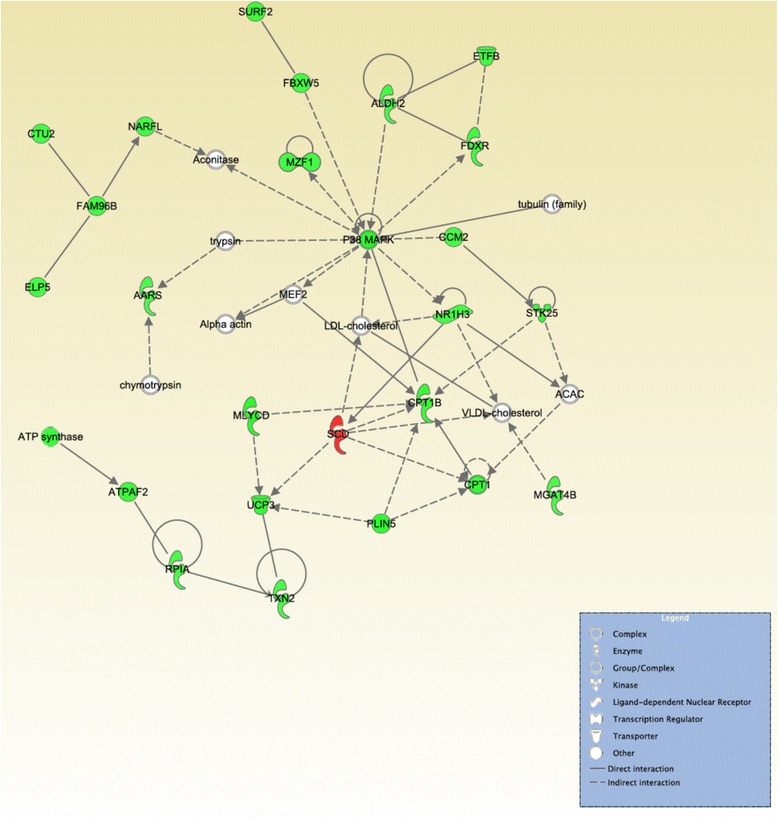
A gene network associated with lipid metabolism and energy production is impacted by OA content. Genes presented in red are up-regulated in the high oleic acid content (H) group. Genes presented in green are down-regulated in the H group. The intensity of the colors is related to the estimated of fold change. Molecules in white are not in the DE list, but were incorporated into the network through relationships with other molecules