
Fig. 3.
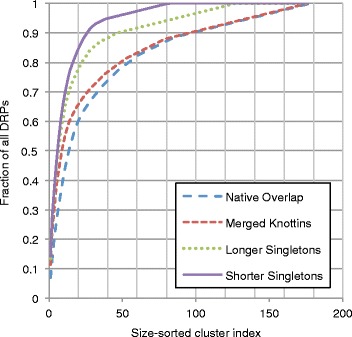
Cluster DRP coverage. Clusters were sorted by size from most to least populated and each cluster was assigned an index starting with 1. At each index i, the cumulative number of DRPs in that cluster and all clusters with index less than i was calculated and divided by the total number of DRPs in the dataset, resulting in the coverage. Coverage as a function of index is displayed. Coverage curves are shown after completion of successive steps of the procedure (red: initial clustering; green: knottin reclustering; purple: longer singleton post-processing; blue: shorter singleton post-processing)