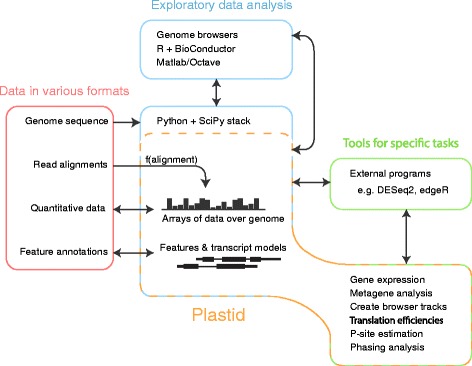
Fig. 1.

Uses of Plastid in analysis workflows. Plastid (yellow box) contains tools for both exploratory data analysis (blue, center) and command-line scripts for specific tasks (green, right). Plastid standardizes representation of data across the variety of file formats used to represent genomics data (left). Quantitative data are represented as arrays of data over the genome. Read alignments may be transformed into arrays using a mapping function appropriate to a given assay. Transcripts are represented as chains of segments that automatically account for their discontinuities during analysis. Plastid integrates directly with the SciPy stack (blue, center). For exploratory analysis in other environments (blue, above) or further processing in external programs (right, green), Plastid imports and exports data in standardized formats
