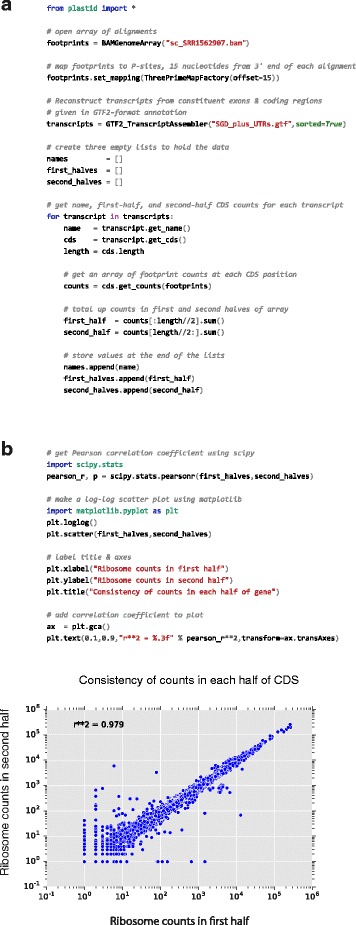
Fig. 4.

Plastid streamlines analysis. a. The quality of a ribosome profiling dataset may be assayed by comparing the numbers of read counts in the first versus second half of each coding region. Plastid makes it possible to implement such analyses with few lines of easily readable code. b. Plastid readily integrates with the tools in the SciPy stack. Here, first- and second-half counts from (a) are plotted against each other using matplotlib, and a Pearson correlation coefficient calculated using SciPy
