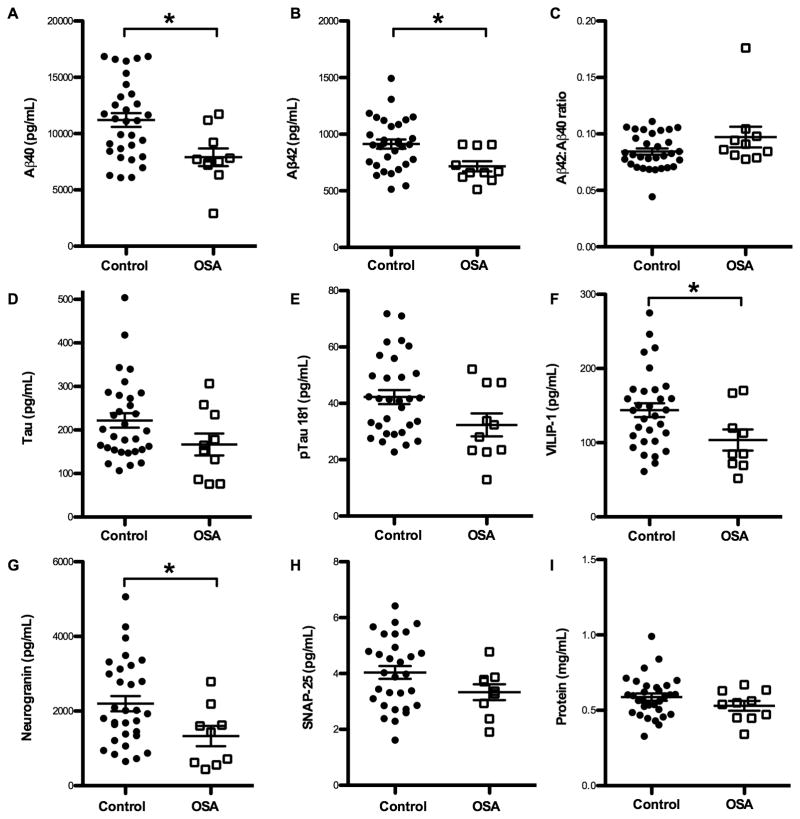
Figure 2. Cerebrospinal fluid Amyloid-β and protein levels.
CSF protein levels are plotted for each individual by group. Mean, standard deviation, and p values are listed in Table 1. Line indicates mean and bars denote standard error. Asterisks indicate p < 0.05. (A) Aβ40 and (B) Aβ42 are significantly lower in OSA compared to Control group. (C) Aβ42:Aβ40, an decrease of which is a sensitive marker of amyloid deposition, was not different between groups. There were strong trends for both (D) Tau and (E) pTau181 being lower in the OSA group. Neuronally-derived proteins (F) VILIP-1 and (G) neurogranin were significantly decreased in the OSA group, and (H) SNAP-25 trended lower also. Total protein (I) was not different between groups. OSA = Obstructive sleep apnea. Aβ40 = amyloid-β-40. Aβ42=amyloid-β-42. pTau181=phosphorylated Tau-181. VILIP-1 = Visinin-like protein 1. SNAP-25 = Synaptosomal-associated protein 25 kDa.

