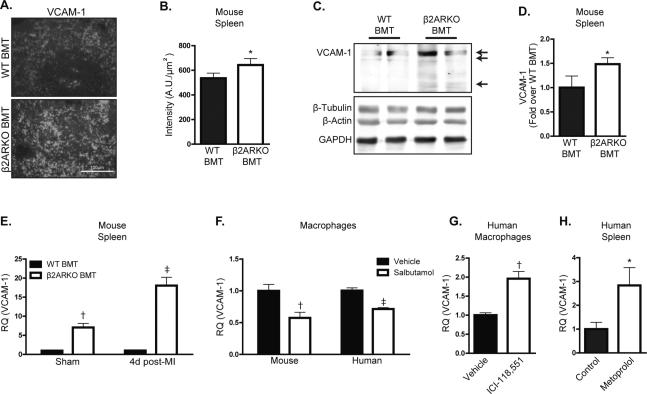
Figure 4.
VCAM-1 is increased in β2ARKO BMT spleens. (A) Immunohistochemistry for VCAM-1 (white) showing levels and localization of VCAM-1 expression in WT and β2ARKO BMT spleens. (B) Quantification of the intensity of VCAM-1 staining. n=5 for WT BMT, n=5 for β2ARKO BMT, Exact Wilcoxon rank-sum test, * p < 0.05 vs WT BMT. (C) Representative immunoblot showing VCAM-1 expression in WT and β2ARKO BMT spleens. Arrows indicate the three isoforms of VCAM-1. Β-tubulin, β-actin and GAPDH are shown as loading controls. (D) Quantification of VCAM-1 immunoblot expression from. n=12 for WT BMT, n=12 for β2ARKO BMT, Exact Wilcoxon rank-sum test, ‡ p < 0.001. (E) RT-qPCR was used to measure VCAM-1 expression in WT or β2ARKO BMT spleens and presented as RQ+RQmax. n=8 for WT BMT sham, n=6 for WT BMT MI, n=6 for β2ARKO BMT sham, n=8 for β2ARKO BMT MI, Exact Wilcoxon rank-sum tests, † p < 0.01, ‡ p < 0.001 vs WT BMT. (F) RT-qPCR was used to measure VCAM-1 expression in mouse (BMDM) or human (THP-1 derived) macrophages and presented as RQ+RQmax. n=7 for mouse vehicle, n=10 for mouse salbutamol, n=9 for human vehicle, n=10 for human salbutamol, Exact Wilcoxon rank-sum tests, † p < 0.01, ‡ p < 0.001 vs Veh. (G) VCAM-1 expression in human macrophages treated with vehicle or ICI-118,551 was quantified by RT-qPCR and presented as RQ+RQmax, Exact Wilcoxon rank-sum test, † p < 0.01 vs Veh. (H) RT-qPCR was used to measure VCAM-1 expression in human spleens from control or metoprolol-treated patients and presented as RQ+RQmax. n=5 for control, n=6 for metoprolol, Exact Wilcoxon rank-sum test, * p < 0.05 vs control.

