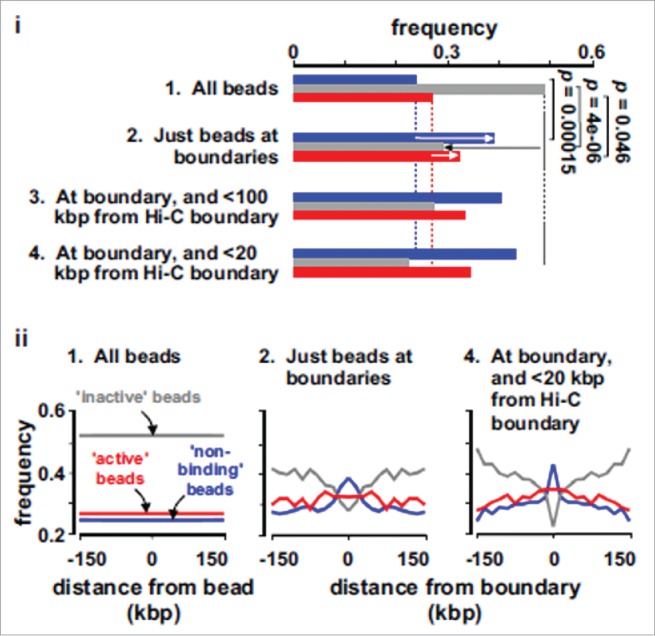
Figure 3.

Characterization of TAD boundaries found in silico. These plots are obtained by analyzing the TAD boundaries found in simulations (through combination of an automated method and visual inspection19), and by computing the frequencies of non-binding (blue bars), inactive (gray bars) and active (red bars) beads in different sets. Set 1: all beads. Set 2: Beads lying within 100 kbp of a boundary. Sets 3 and 4: The sub-sets of set 2 that also lie within 100 and 20 kbp of a boundary identified in Hi-C data. (i) Beads at boundaries are rich in active and non-binding beads, and depleted of inactive beads (arrows; p values assessed assuming Poisson distributions). (ii) The frequencies of different beads (in sets 1, 2 and 4) in the 150 kbp on each side of either each bead in set 1, or of boundaries in sets 2 and 4. Adapted from Ref.19
