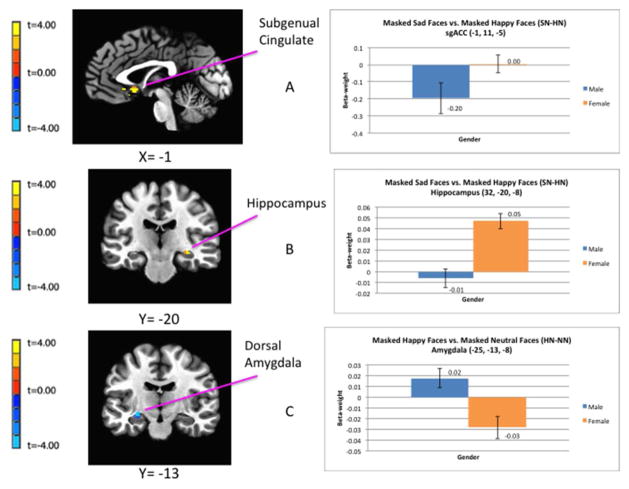
Figure 1.
Regional differences in hemodynamic response between males and females while viewing emotionally-expressive face stimuli presented below the level of conscious awareness using the backward masking task. The clusters of voxels for which pcorrected<0.05 in the fMRI contrasts are superimposed on sagittal or coronal sections from co-registered, anatomical MRI images (left column). Adjacent to each image is the corresponding bar graph showing contrast beta-weights plus standard error bars that correspond to the differences between female and male subjects measured over the peak voxel t-value shown in the image data. The figures in A and B show the difference in BOLD activity between females and males in response to masked sad versus masked happy face stimuli (SN-HN) in the left sgACC (A) and right hippocampus (B). The figures in (C) show the regional difference in BOLD activity between females and males in response to happy versus neutral face stimuli (HN-NN) in the left amygdala. Coordinates for the peak T-values correspond to the stereotaxic array of Talairach and Tournoux (1988) as the distance in mm from the anterior commissure (positive x = right, positive y = anterior, positive z = dorsal). Abbreviations: HN-NN = masked happy versus masked neutral faces; SN-HN = masked-sad versus masked-happy faces; sgACC = subgenual anterior cingulate cortex.

