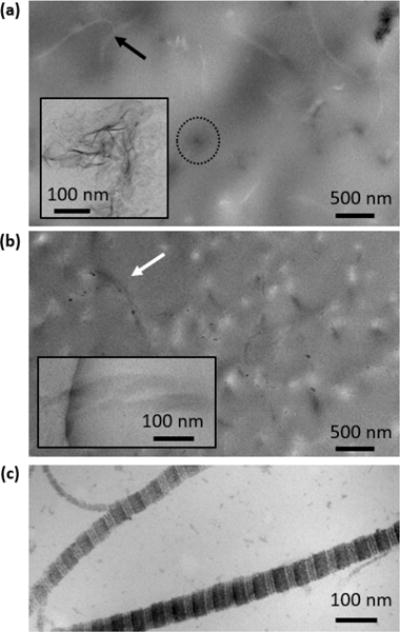
Figure 5.

TEM images of thin sections of collagen matrices. (a) Near the outer surface (z = 0) of a MC0p sample at 15 h. The black arrow indicates an unmineralized collagen fibril. The dashed circle surrounds an aggregate of extrafibrillar CaP plates. The inset is a high resolution TEM image of extrafibrillar CaP plates, corresponding to the features in the circle. (b) Near the outer surface (z = 0) of the MC10p at 15 h. The higher magnification inset is taken from a neighboring area of the sample. Collagen fibrils, indicated with a white arrow, are mineralized, showing darker contrast than the surrounding epoxy resin. No staining was applied to collagen fibrils for (a) and (b) because precipitates from staining cannot easily be distinguished from CaP particles formed within the matrices. (c) Stained unmineralized collagen fibrils demonstrated a clear banding pattern of collagen fibrils.
