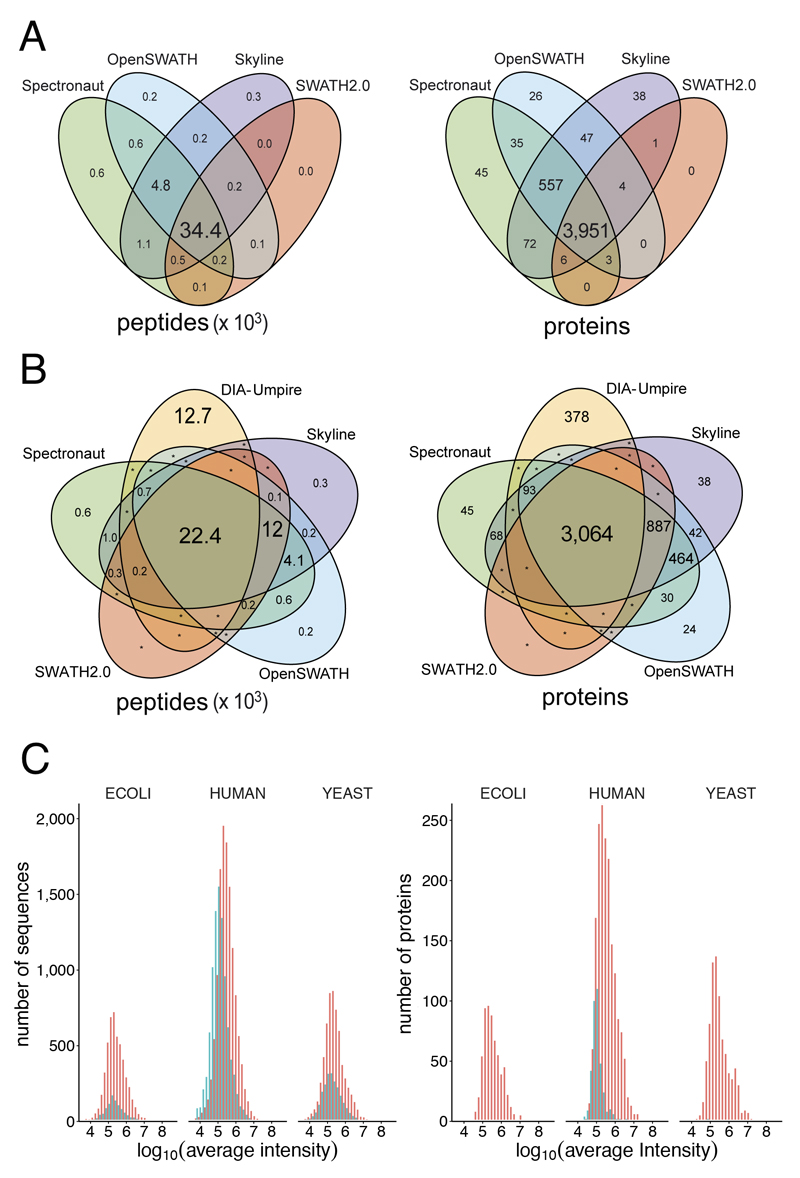
Figure 3. Integrated analysis of the five software tools.
(a) Overlap of quantified peptides and proteins for library-based tools. The font size of each element is proportional to the number of peptides or proteins displayed. (b) Overlap of quantified peptides and proteins by all software tools. The font size of each element is proportional to the number of peptides or proteins displayed. An asterisk indicates protein/peptide numbers below ten. (c) Protein abundance distribution of peptides and proteins detected by DIA-Umpire. Red: peptides or proteins shared with other software tools. Turquoise: peptides or proteins detected exclusively by DIA-Umpire.

