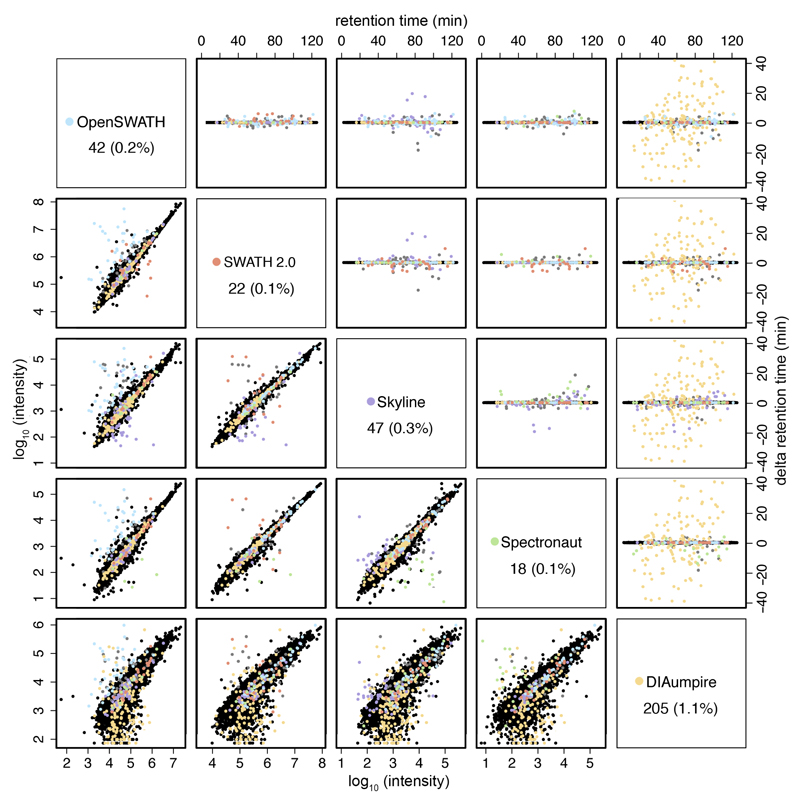
Figure 4. Retention time differences and correlation of reported peak intensities between all software tools for the respective matching precursors.
Retention time outliers (upper right panels) are plotted in the color of the outlier software tool (see color legend in the diagonal panels). Diagonal panels show the total number and percentage (to the total number of common detected peptides) of outliers of each respective software tool. Outliers have been defined as producing a standard deviation of the peak retention time greater than 0.2 minutes relative to all other software tools detecting that precursor, after removing ambiguous cases, in which more than one software tool produce a greater standard deviation in the peak retention time. The correlation of reported peak intensities is displayed at the lower left panels. The retention time outliers are also marked in the respective correlation plots.

