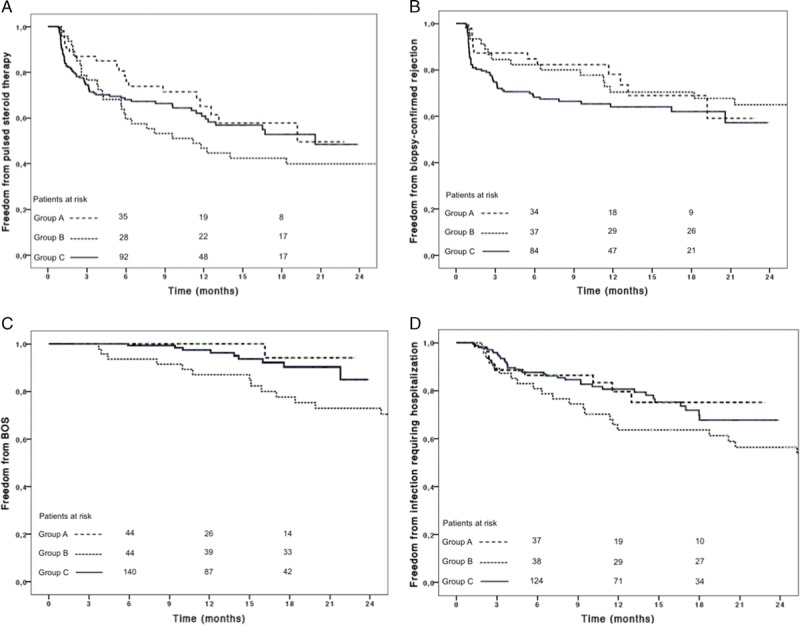
FIGURE 3.

Freedom from pulse steroid therapy (A), biopsy-confirmed rejection (B), BOS (C), and from infection requiring hospitalization (D) are reported. Patient at risk are reported above the x-axis. The curves for group B patients have been truncated at 2 years of follow-up.
