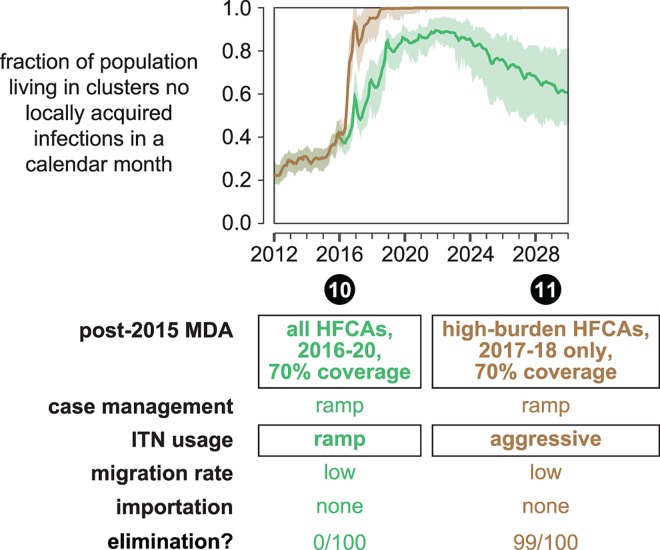
Fig 9. Higher MDA coverage cannot overcome insufficient vector control.
In scenarios 10 and 11, post-2015 MDAs have a higher coverage of 70%. The fraction of total study area population living in clusters where no local transmission has occurred over a month-long period is plotted for each month between January 2012 and January 2030. Line indicates the mean and shaded area the range observed over 100 samples from the joint posterior distribution of 10 best-fit habitat availability pairs for each cluster. A simulation results in elimination if no new infections occur in all clusters over a 3-year period. The “elimination” row indicates the fraction of simulations where elimination was observed.

