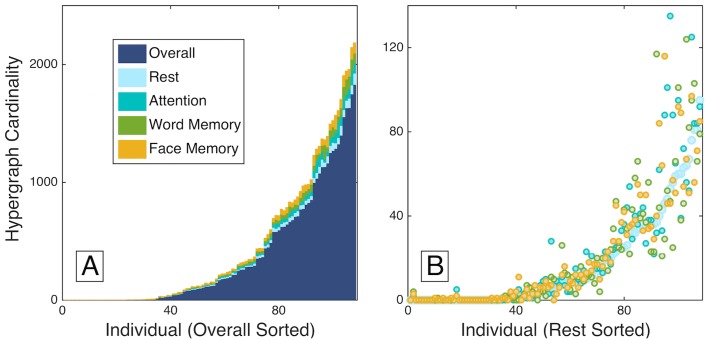
Fig 5. Individual variability.
Hypergraph cardinality for individual overall multi-task hypergraphs is shown in panel (A), sorted by increasing overall cardinality. Individual task-specific hypergraph cardinality is shown atop the overall cardinality for comparison, and is also sorted by increasing overall cardinality. Panel (B) depicts the cardinality for task-specific hyperedges, sorted by rest cardinality. The number of hyperedges across tasks is fairly consistent within individuals, in contrast to the range of hyperedge number across individuals.

