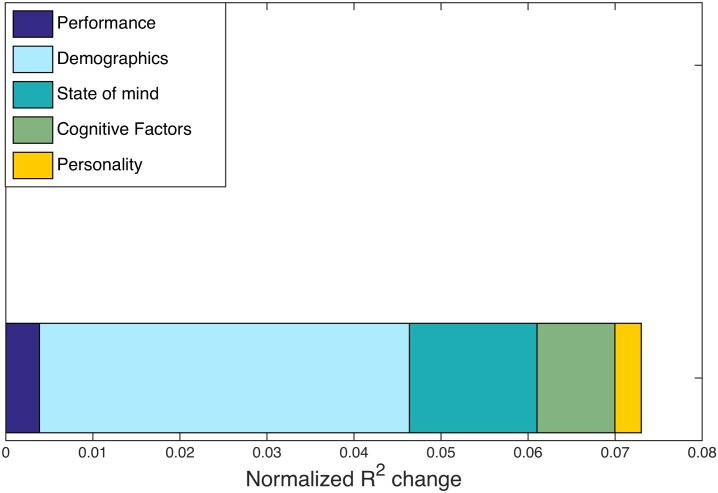
Fig 6. Multi-task R2 changes.
Normalized R2 changes with respect to hypergraph cardinality are shown for individuals in the multi-task study. R2 changes are calculated from the regression procedure outlined in Methods, with five distinct categories common to the multi-task and age-memory studies. The largest normalized R2 change is from the demographics factor, but no factors exhibit a signficant correspondence with hypergraph cardinality.

