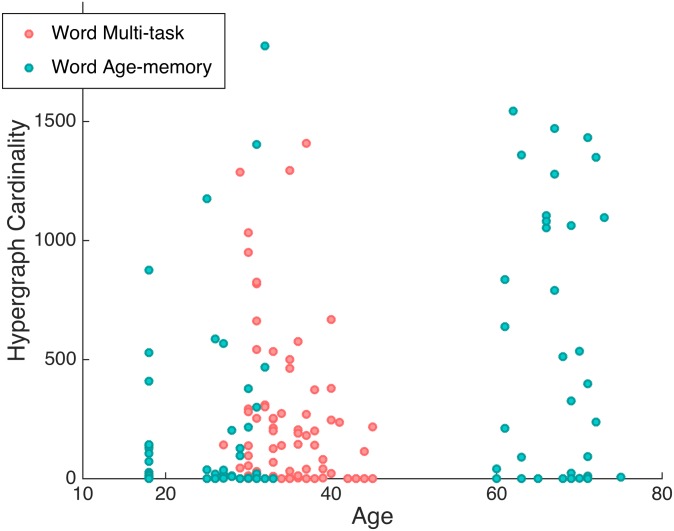
Fig 10. Hypergraph cardinality and age.
Hypergraph cardinality is shown as a function of age for the age-memory data set (blue) and word memory task of the multi-task data set (pink). Three distinct age groups are present for the age-memory data, while the multi-task ages overlap with the middle age-memory group. The correspondence between increasing age and larger hypergraph cardinality can be observed, where few older subjects have low hypergraph cardinalities, but the majority of the youngest subjects have cardinalities lower than 500.

