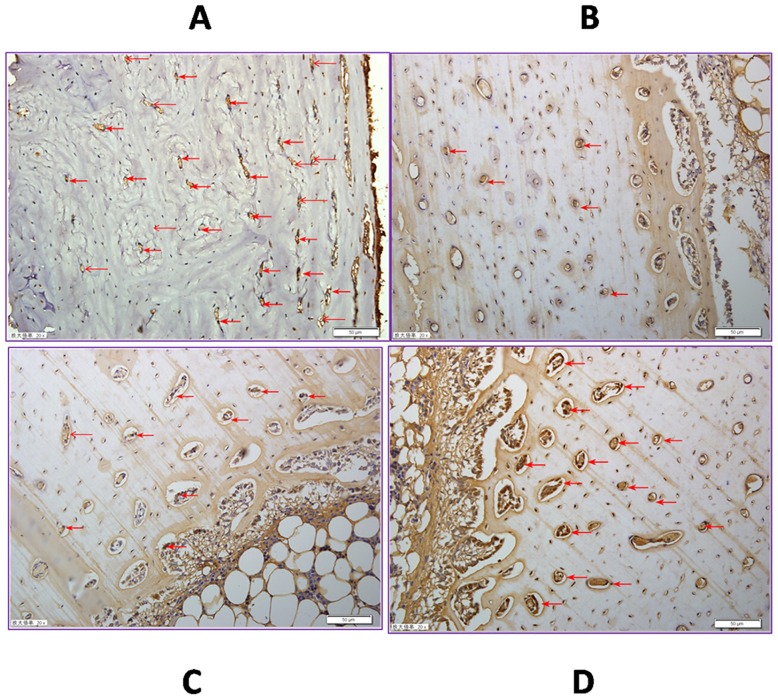
Fig 3. Substance P semi quantitation of left tibia 4 weeks post treatment.
SP staining is shown in brown (red arrow). Scale bar = 50μm. Values are means ±SD of six rabbits in each group. A. SP in sham groups were higher than all others (p<0.05); B. SP in SNCr group was less than all others (p<0.05); C.SP in treadmill group was higher than SNCr group (p<0.05), less than ET group (p<0.05); D. SP in ET group was higher than other groups (p<0.05), except sham groups, was lower than sham groups (p<0.05).

