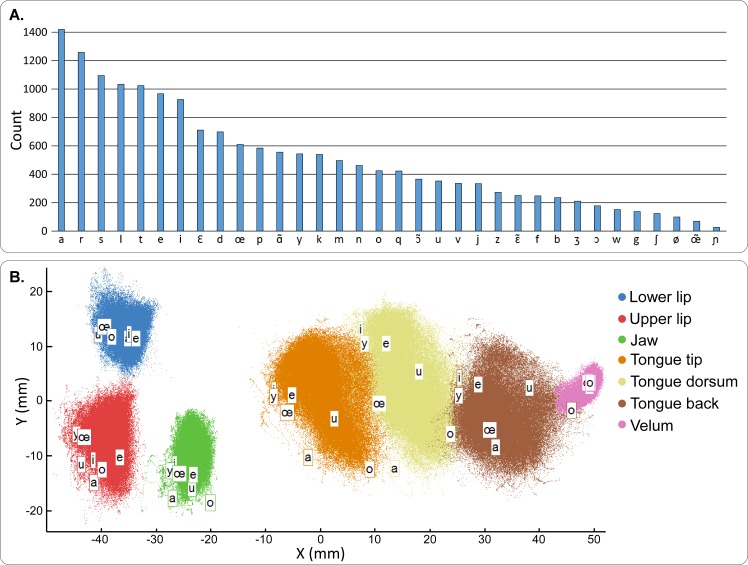
Fig 3. Articulatory-acoustic database description.
A–Occurrence histogram of all phones of the articulatory-acoustic database. Each bar shows the number of occurrence of a specific phone in the whole corpus. B–Spatial distribution of all articulatory data points of the database (silences excluded) in the midsagittal plane. The positions of the 7 different sensors are plotted with different colors. The labeled positions correspond to the mean position for the 7 main French vowels.

