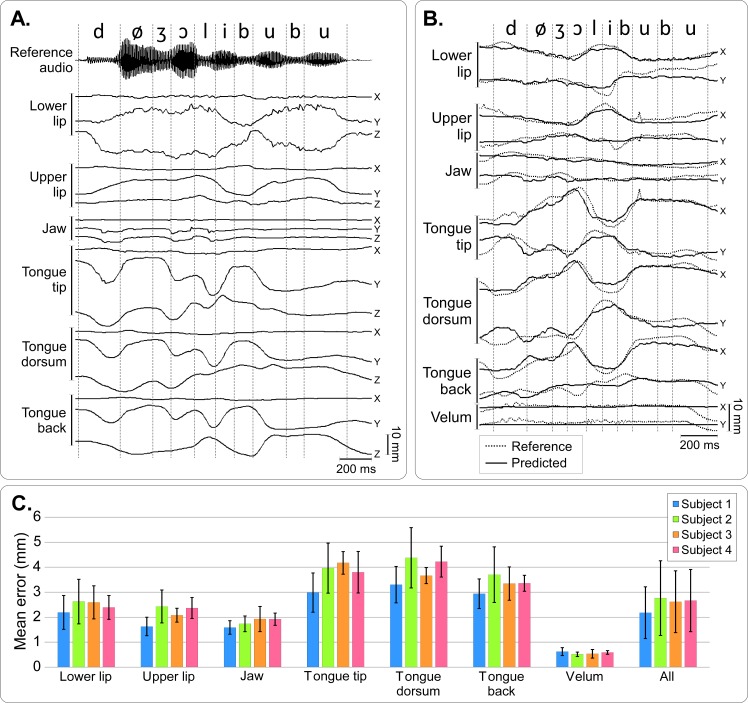
Fig 9. Articulatory-to-articulatory mapping.
A–Articulatory data recorded on a new speaker (Speaker 2) and corresponding reference audio signal for the sentence “Deux jolis boubous” (“Two beautiful booboos”). For each sensor, the X (rostro-caudal), Y (ventro-dorsal) and Z (left-right) coordinates are plotted. Dashed lines show the phonetic segmentation of the reference audio, which the new speaker was ask to silently repeat in synchrony. B–Reference articulatory data (dashed line), and articulatory data of Speaker 2 after articulatory-to-articulatory linear mapping (predicted, plain line) for the same sentence as in A. Note that X,Y,Z data were mapped onto X,Y positions on the midsagittal plane. C–Mean Euclidean distance between reference and predicted sensor position in the reference midsagittal plane for each speaker and each sensor, averaged over the duration of all speech sounds of the calibration corpus. Error bars show the standard deviations, and “All” refer to mean distance error when pooling all the sensors together.

