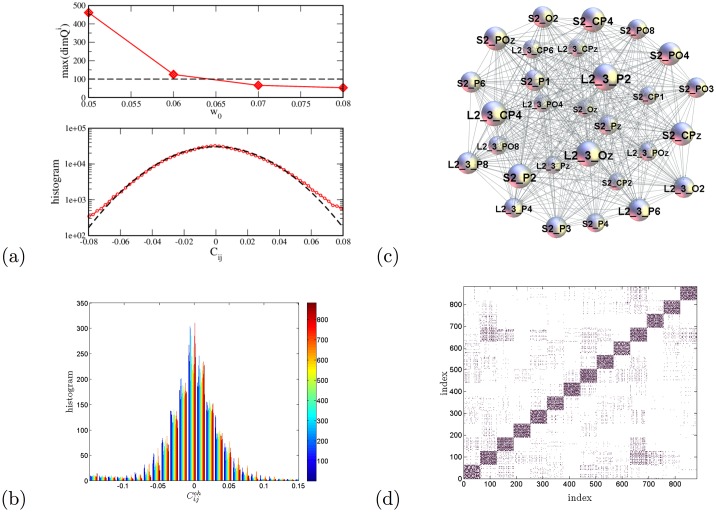
Fig 3. Mapping multi-brain correlations.
(a) Maximum topological dimension plotted against various thresholds w0 (top panel) stabilises near the selected threshold 0.06. The middle part of the histogram of correlation coefficients averaged over 882 channels (lower panel); the fit by the normal distribution, dotted line, deviates from the data for the correlations larger than 0.06. (See the histogram for the whole range in Fig A(b) in S1 File). (b) The central part of the histograms for different channels. For a particular channel, the correlations with other 881 channels are marked by the corresponding colour indicated in the colour map; the presence of colours over different bins suggests that all channels obey a similar distribution. (c) An example of higher-order structure involving the signal locations at two scalps—the speaker’s S2 and the listener’s L2−3. (d) The adjacency matrix of the multi-brain network of the two speakers and 12 listeners with the threshold w0 = 0.06. The order of indexes is as explained in the text.

