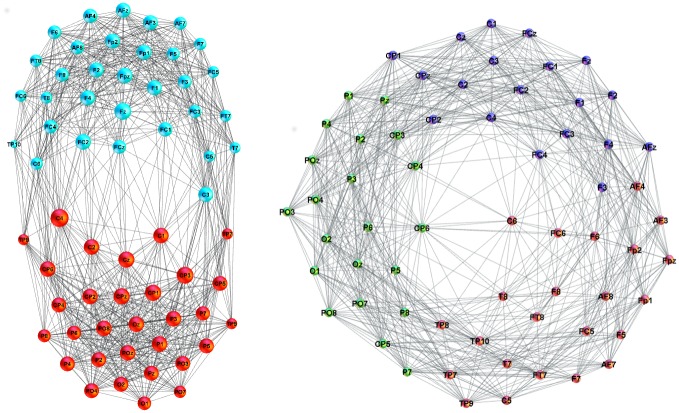
Fig 4. Functional brain network from EEG signals.
(left) An example of network mapping the functional brain connections recorded by EEG signals on the speaker’s scalp (labels). The applied threshold w0 = 0.06. The colour of nodes indicates two identified communities—frontal (F) and parietal (P). (right) Loss of the F/P community structure at a lower threshold w0 = 0.05 in the correlation matrix.

