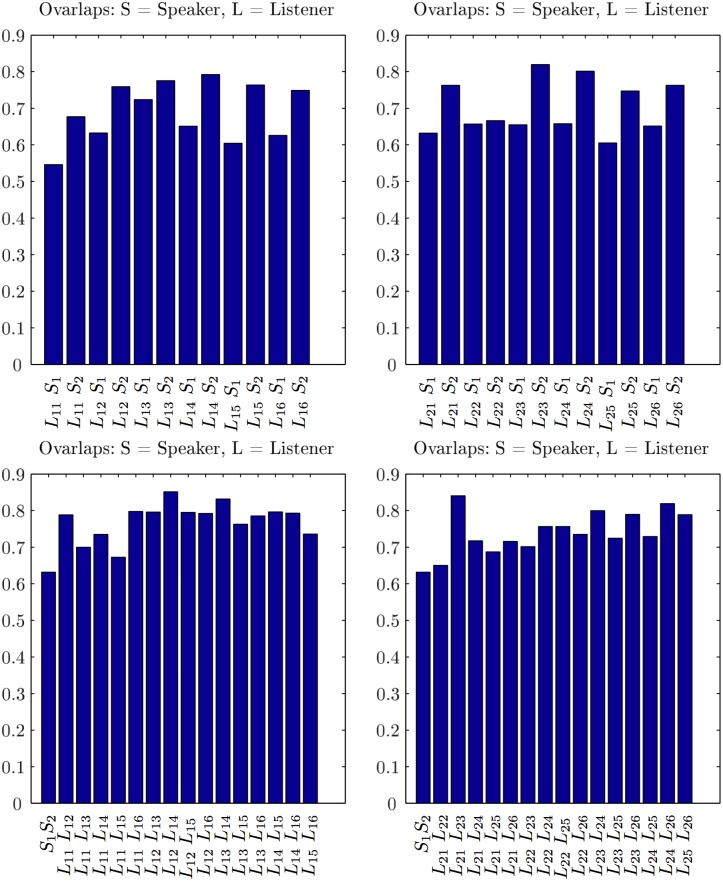
Fig 6. The similarity of single-brain networks in stimulus1.
SBN overlaps between each listener in group 1 with speakers S1 and S2, the left panel, and each listener in group 2 with S1 and S2, right panel. Bottom left and right panels show the SBN overlaps between pairs of listeners in the group 1 and group 2, respectively. For a comparison, the SBN overlap between two speakers is also shown (the first bar in each bottom panel). Note that all overlaps are significantly larger than in the corresponding randomised models (see Figs C and D in S1 File).

