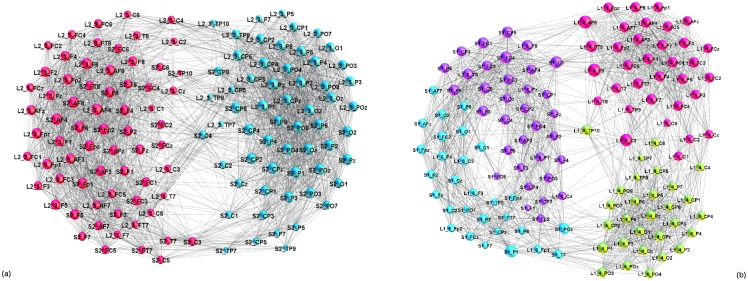
Fig 10. Structure of inter-brain linking.
Superbrain network of the speaker S2 and the listener L2−3, illustrating proper coordination, (left), and a weakly connected two-brain structure of the listener L1−4 and the speaker S1, corresponding to wrong coordination (right). Different colour of nodes indicates the identified functional communities. The node’s labels belong to the unique list of 882 scalp locations of all participants; for example, L2−3−TP9 and S2−F7 indicate the channel “TP9” on the scalp of the listener 3 in group 2, and channel “F7” of the scalp of the speaker S2, respectively. See also the overlaps in Fig 6 and distances in Fig 8 for these pairs.

