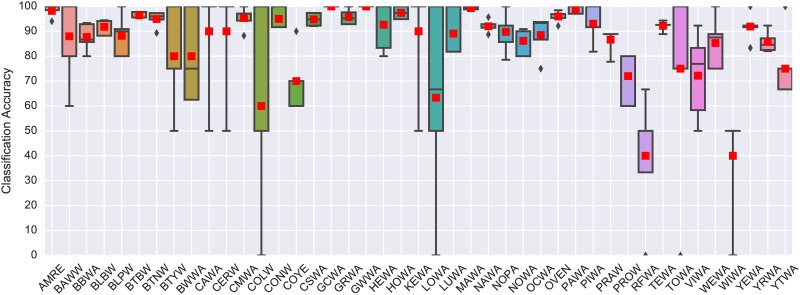
Fig 3. Per-class (per-species) classification accuracy obtained by the proposed model for each of the 43 species in CLO-43SD.
The box plots are derived using 5-fold cross validation, where the red squares represent the mean score for each species. A mapping between the abbreviations used in this plot and the full species names is provided in S1 Table.

