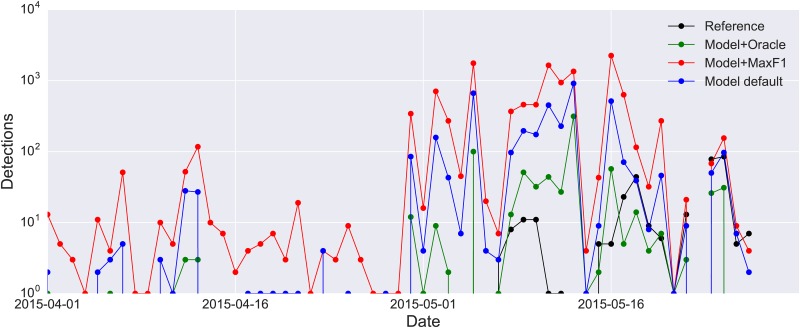
Fig 11. Detection curves showing the daily number of detected SWTH calls in the CLO-SWTH test set.
The true curve (the reference, computed from the expert annotations) is plotted in black. The other three curves represent detections generated by the proposed model using different threshold values: the default (0.5) in blue, the threshold that maximizes the f1 score (which quantifies the trade-off between precision and recall by computing their harmonic mean) on the training set (0.29) in red, and the “oracle threshold” (0.73) that maximizes the f1 score on the test set in green.

