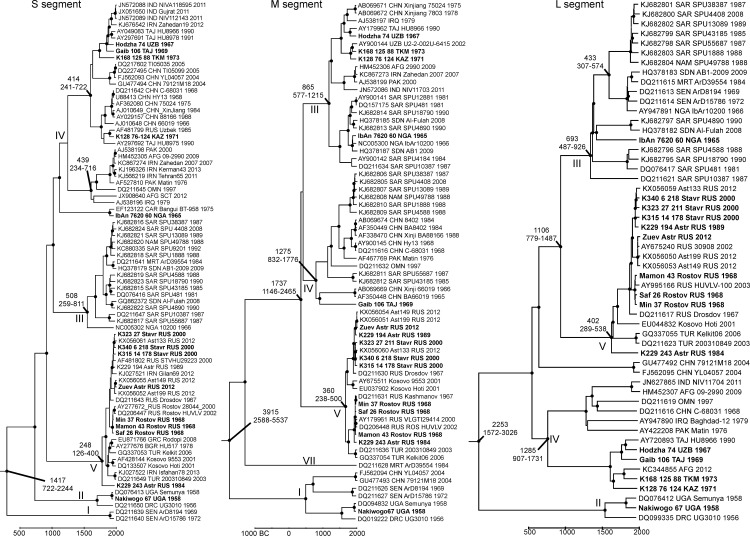
Fig 1. Bayesian phylogenetic trees for complete S, M and L segment sequences.
Names of strains sequenced here are indicated in bold. Roman numerals at tree nodes indicate genotypes. The scale bar shows time in years. Nodes with posterior probabilities > 0.95 are marked with black dots. Height and height 95% HPD are indicated for selected nodes.

