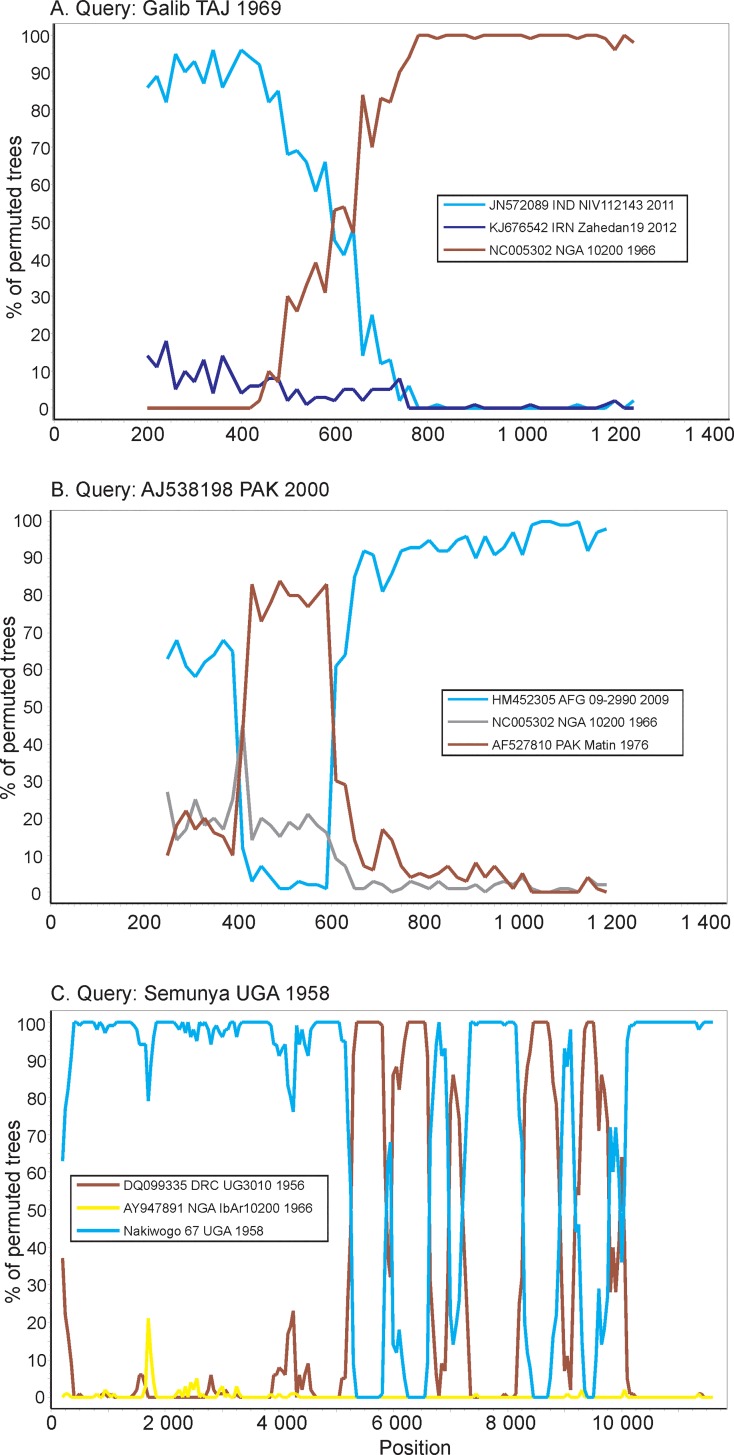
Fig 4. Bootscan analysis of exemplary CCHFV genomes.
The Y axis shows the percentage of phylogenetic trees with a reliably supported grouping of a query sequence with sequences indicated in the legend in a sliding window that corresponds to the x axis. A. S segment, window 400 bp, step 20 bp. B. S segment, window 500 bp, step 20 bp. C. L segment, window 400 bp, step 50 bp.

