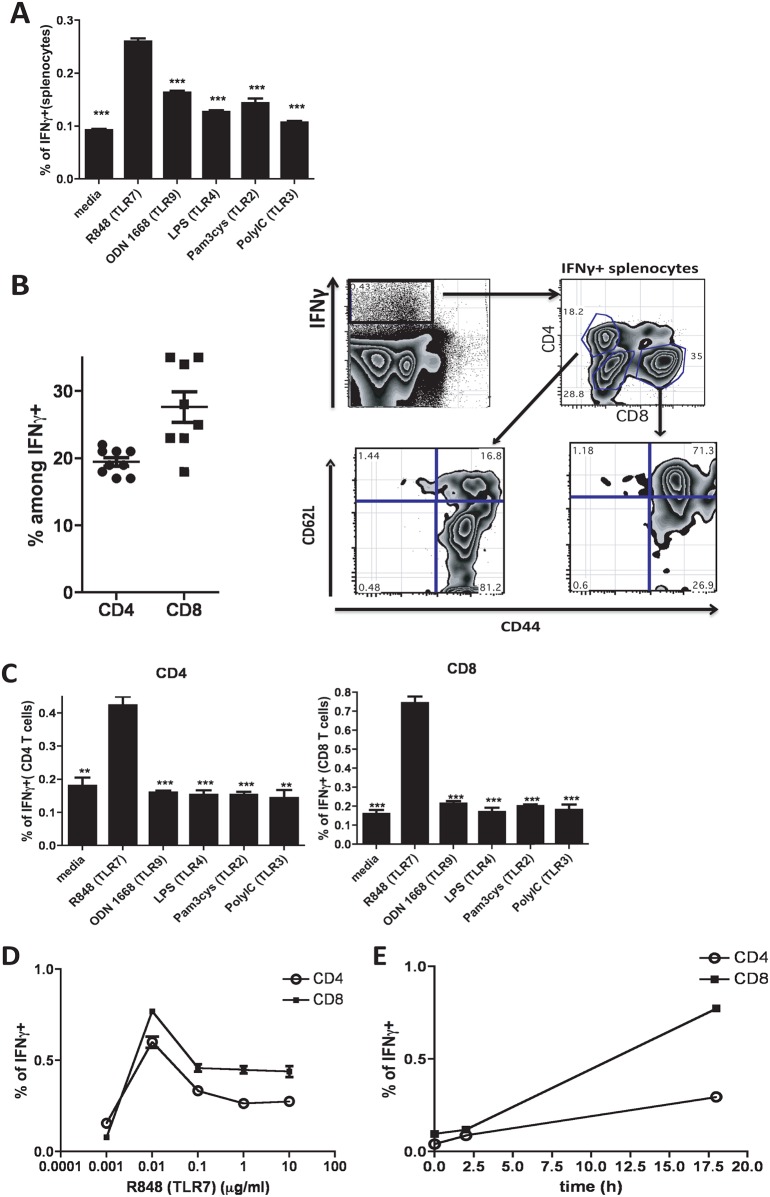
Fig 1. Subsets of CD4 and CD8 memory T cells produce IFNγ in response to TLR7 simulation in vitro.
Splenocytes from C57Bl/6 mice were cultured in vitro for 18h in the presence of different TLR agonists (as indicated). Cells were stained for surface markers and intracellular IFNγ. (A) Bars represent percentage of total splenocytes positive for intracellular IFNγ. (B) Gating strategy for IFNγ+ splenocytes upon TLR7 simulation for 18h (Representative FACS plots) and quantification of CD4 and CD8-positive cells among IFNγ+ splenocytes. (C) Bar graphs represent percentages of IFNγ+ among CD4 or CD8 T cells after 18h of splenocytes stimulation with different TLR ligands as indicated. (D, E) Percantages of IFNγ+ CD4 and CD8 T cells in response to different doses (D) or different time (E) of stimulation with R848. Bars represent the means +/- SEM (n = 3). All data are representative of three or more independent experiments. Statistics is shown for each condition over R848 stimulated cultures.

