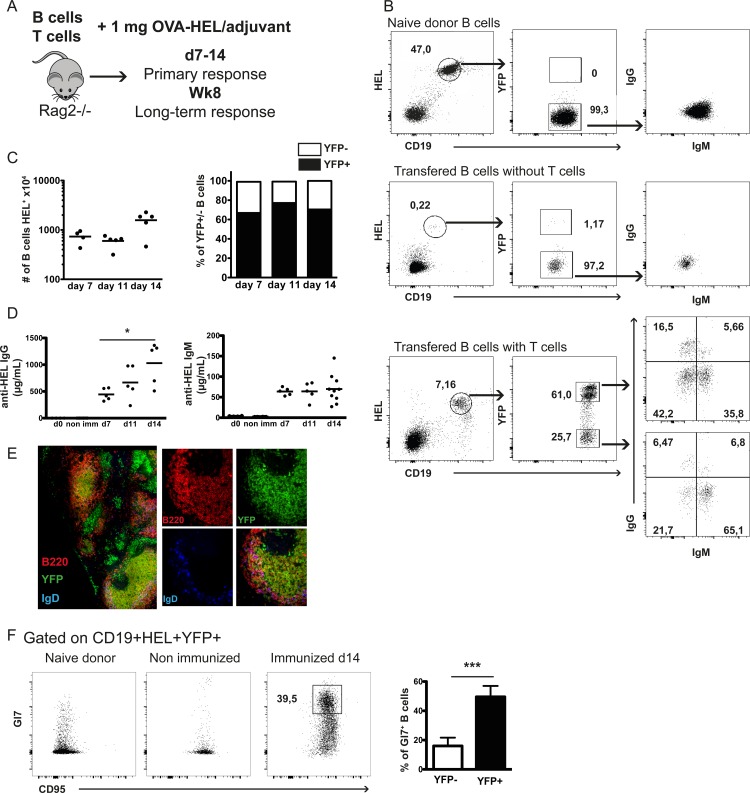
Fig 1. Development of B cell primary response upon adoptive transfer of SWHEL.AID/YFP.Rag2-/- B cells.
(A) Rag2-/- hosts were injected intravenously with naive SWHEL.AID/YFP.Rag2-/- B cells together with OTII.Rag2-/- naive CD4 T cells. Recipient mice were immunized 24 hours later and B cell response analyzed 7, 14 days and 8 weeks after. (B) Flow cytometric analyses of specific HEL+ CD19+ (left panels) splenic B cells from SWHEL.AID/YFP.Rag2-/- naive donor (upper panels), immunized mice reconstituted only with B cells (middle panels) and immunized mice reconstituted with both B and T cells 14 days after immunization (lower panels), for the expression of YFP (middle panels), and IgM and IgG (right panels). (C) Number of splenic B cells recovered from the recipient mice (left panel) and repartition of AID/YFP- and AID/YFP+ among splenic B cells (right panel) 7, 11 and 14 days after immunization. (D) Seric levels of anti-HEL specific IgG (left panel) and IgM (right panel) in immunized recipients 7, 11 and 14 days after immunization. (E) AID/YFP (green), B220 (red), IgD (blue) (right panels) and merged (left and right panels) expression by confocal microscopy analysis of spleen slices 14 days after immunization. (F) Analysis of germinal center B cells in immunized mice. Left panel shows the co-expression of Gl7 and CD95 by B cells from naive (left dot plot), non-immunized (middle dot plot) and 14 day-immunized mice (right dot plot). Right panel shows the % of Gl7hi CD95+ cells among AID/YFP- (white bar) and AID/YFP+ (black bar) splenic B cell subsets from 14 day-immunized mice. Data (mean ± SEM) are shown for one experiment representative of 3, with 4–5 mice per group. Significances were calculated using Student t-tests, *, P<0.05; ***, P<0.001.

