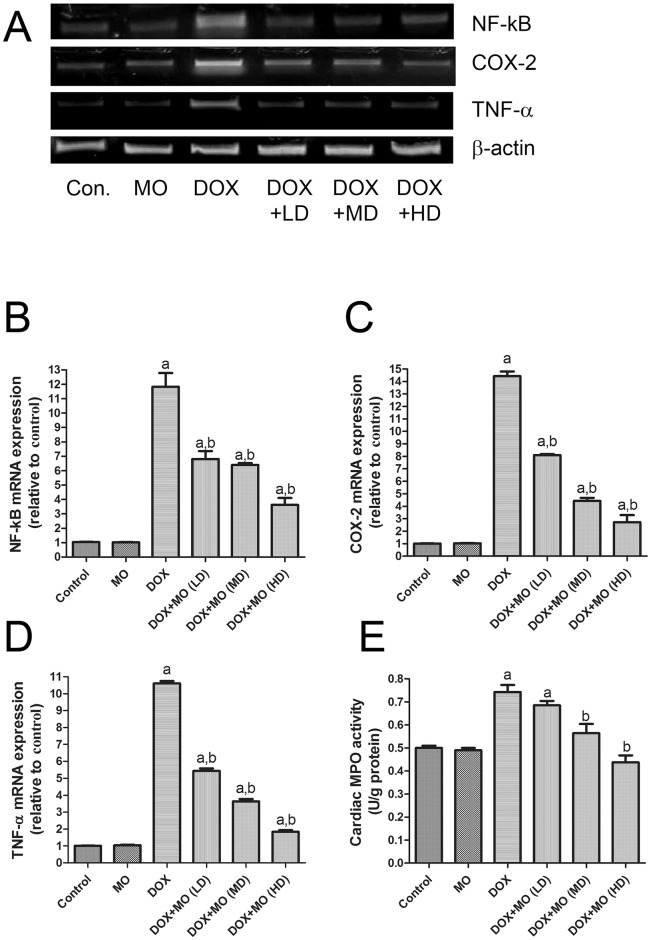
Fig 3. Effect of MO on inflammation related parameters.
(A) Gel photograph depicting representative analysis of NF-κB, COX-2 and TNF-α mRNA expression. Data are expressed as fold change (relative to control group) and as mean ± S.E.M. of three independent rats of each group. (E) Cardiac MPO activity. Data represent as mean ± S.E.M. of seven independent rats of each group. a P<0.05 vs. control; b P<0.05 vs. DOX.

