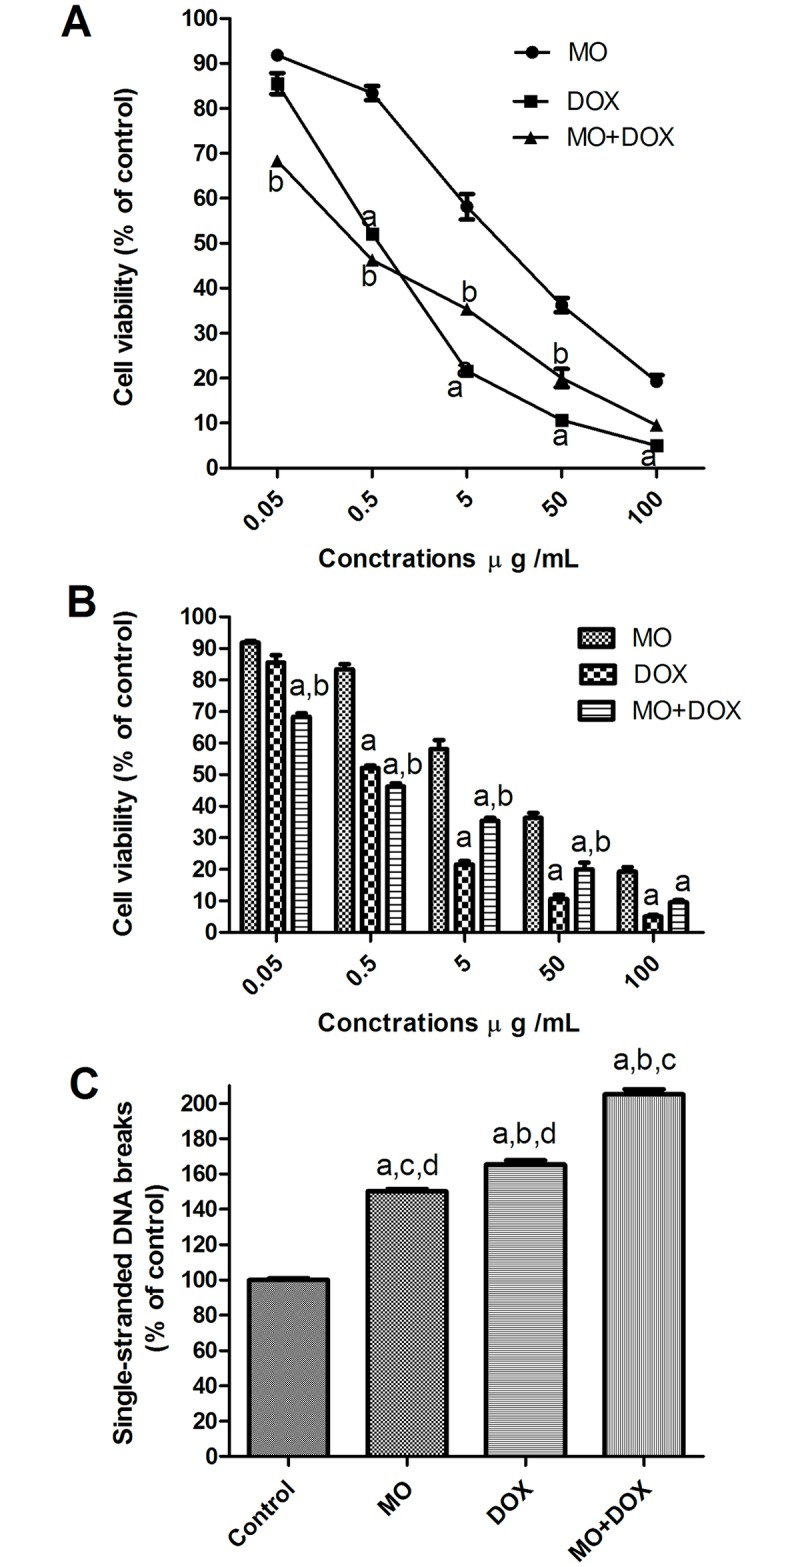
Fig 5. Effect of MO, DOX and their combination on viability and apoptosis of MCF-7 cells.

(A and B) the effect of MO on the dose-response curve of DOX in MCF-7 cells. Cells were exposed to serial dilution of MO, DOX or combination of MO with DOX for 72h. Cell viability was after 72 h was measured using MTT assay. (C) Quantification of apoptosis induced by MO, DOX and their combination. The cells were treated with IC50 for 48 hrs. a P<0.05 vs. MO; b P<0.05 vs. DOX. Apoptosis was quantified by ELISA as single-stranded DNA. The data are expressed as percentages of control cells. Each point represents the mean ± S.E.M. of three independent experiments. a P<0.05 vs. control; b P<0.05 vs. MO; c P<0.05 vs. DOX; d P<0.05 vs. MO+DOX.
