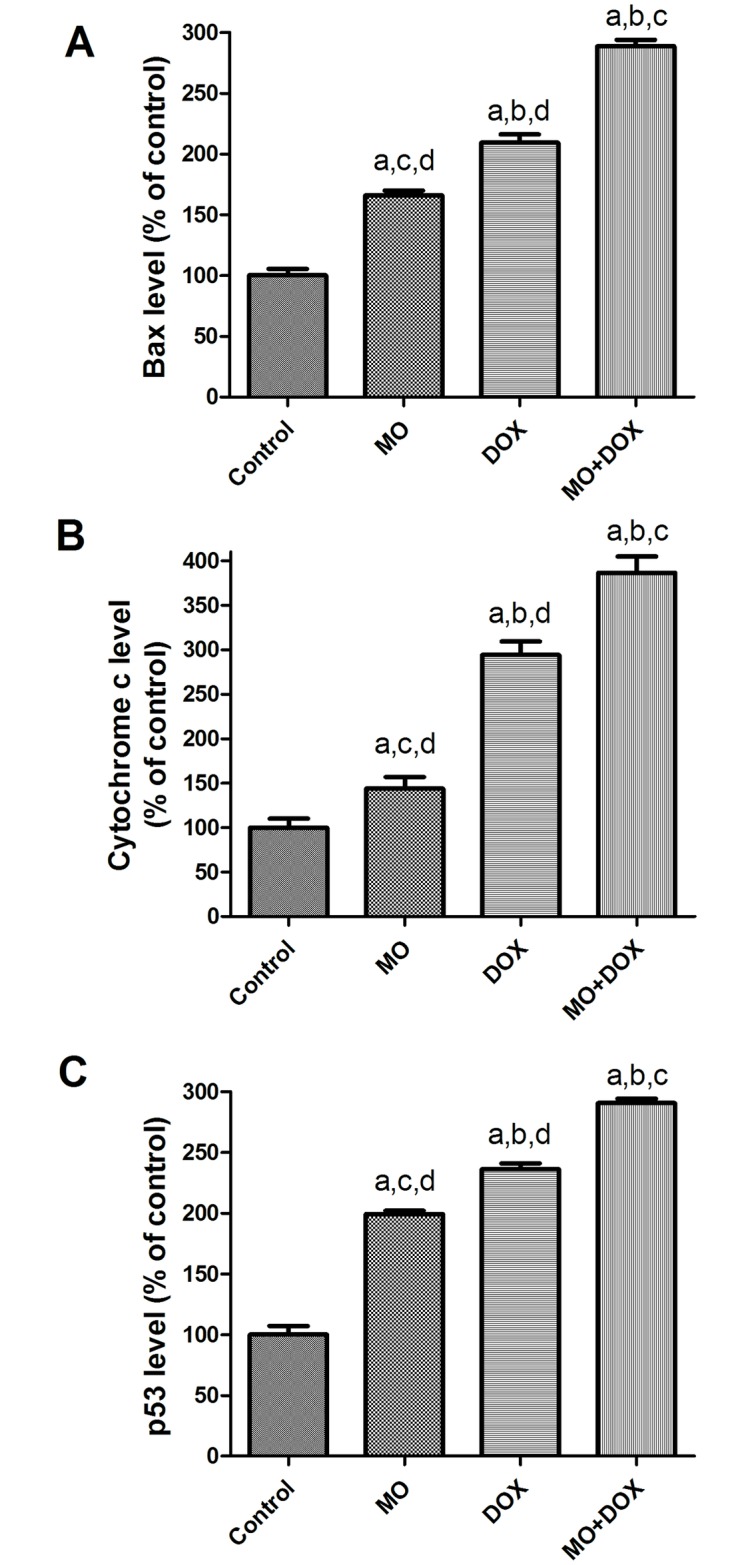
Fig 6. Effects of MO and DOX and their combination on pro-apoptotic proteins in MCF-7 cells.

The protein expression of (A) Bax, (B) cytochrome c and (C) p53 levels were examined by ELISA in supernatant from MCF7 cells treated with IC50 of MO and DOX for 48 h. The data are expressed as percentages of control cells. Each point represents the mean ± S.E.M. of three independent experiments. a P<0.05 vs. control; b P<0.05 vs. MO; c P<0.05 vs. DOX; d P<0.05 vs. MO+DOX.
