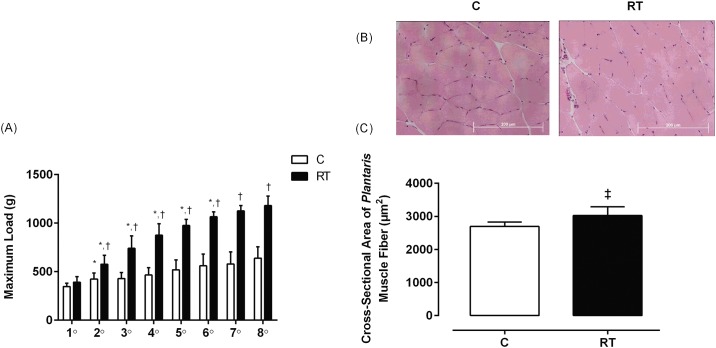
Fig 1. Resistance training responses in the maximum load test and the CSA of the Plantaris muscle fiber.
(A) Evolution of maximum load (g) of the C (n = 5) and RT (n = 6) groups during 8 weeks of the RT protocol. Repeated measure ANOVA followed by Duncan’s post hoc. (B) Representative images (40x magnification) of Plantaris muscle fibers stained with HE from the C (n = 5) and RT (n = 6) groups. (C) CSA of Plantaris muscle fiber calculated from the HE-stained posterior sections using Student’s t tests for independent samples. The data are presented as the mean ± standard deviation, significance accepted: p ≤ 0.05. *—Different than the previous maximum load in the same group; †—Different than the maximum load in the C group at the same time; ‡—Different from the C group.

