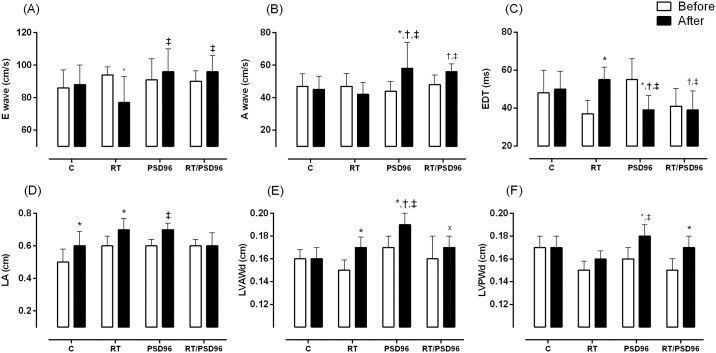
Fig 5. Main echocardiographic variables.
Results of (A) E wave: maximum protodiastolic mitral flow velocity; (B) A wave: maximum telediastolic mitral flow velocity; (C) EDT: E-wave deceleration time; (D) LA: left atrium diameter; (E) LVAWd: diastolic left ventricle anterior wall thickness; (F) LVPWd: diastolic left ventricle posterior wall thickness. Repeated Measure ANOVA with post hoc Duncan Test. The data are presented as the mean ± standard deviation, significance accepted: p ≤ 0.05. N = 10. *—Different from the baseline of the same group; †—Different from the C group at the same time; ‡—Different from the RT at the same time; x—Different from the PSD96 group at same time.

