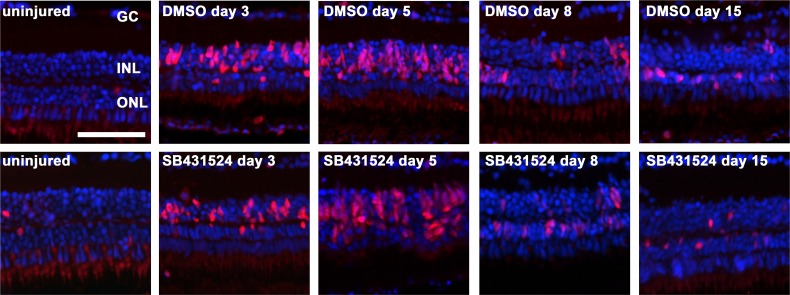
Fig 6. Cell proliferation in the zebrafish retina exposed to 150 mg/l MNU.
Proliferating cell nuclear antigen (PCNA) positive cells (red) indicate proliferation. Cell proliferation in the inner nuclear layer (INL) was highest at day 3 and 5, with no relevant difference between the non-inhibited (0.1% dimethyl sulfide, DMSO) and inhibited group (small molecule inhibitor SB431542). In contrast, proliferation in the outer nuclear layer (ONL) was higher in the inhibited group between 3 and 8. Cell nuclei are stained with DAPI (blue). Scale bar indicates 50 μm. GC: ganglion cells.

