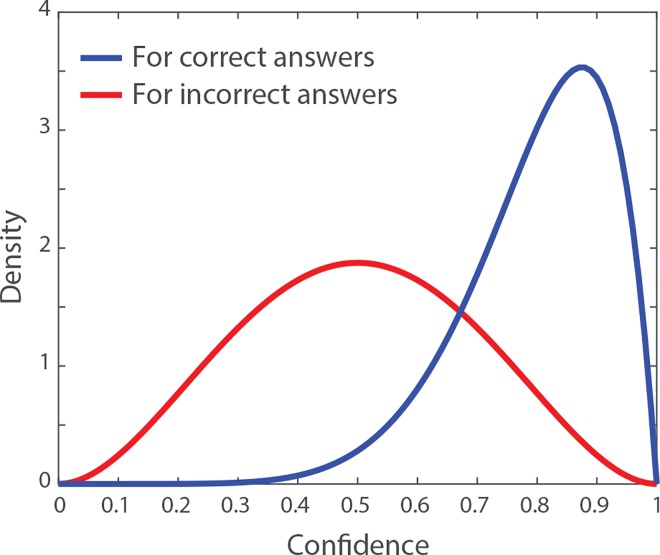
Fig 1. Description of the environment.
Assumed distributions of confidence among the individuals who provide the correct answer to the problem (in blue), and among those who provide a wrong answer to the problem (in red). The interval of confidence values ranges from c = 0 (very uncertain) to c = 1 (very certain). The blue and red distributions are beta distributions with shape parameters α1 = 8 and β1 = 2 (mean value: 0.8), and α0 = 3 and β0 = 3 (mean value: 0.5), respectively. In the simulations, a proportion q1 of the sample population gives the correct answer and have confidence levels drawn from the blue distribution, and a proportion q0 = 1 − q1 of the sample population gives a wrong answer and have confidence levels drawn from the red distribution. In empirical data, the shape parameters of the blue and red distributions depend on the nature of the task.

