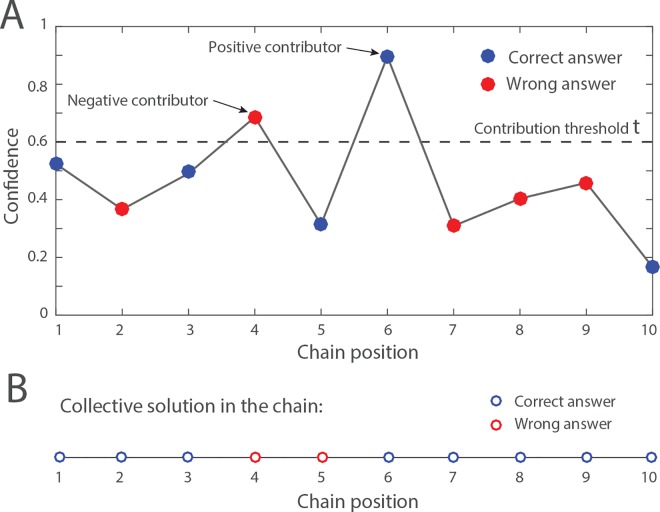
Fig 2. Illustration of a transmission chain.
For this case study, we assume a group size of N = 10, and a proportion of correct answers q1 = 0.6. (A) The N individuals are randomly drawn from the sample population and assigned to a random position in the chain (the red and blue dots). Among them, five individuals have the correct answer (i.e., the blue dots at chain positions 1, 3, 5, 6, and 10), and five individuals have a wrong answer (i.e., the red dots at chain position 2, 4, 7, 8, and 9). The black dashed line represents the activity threshold τ = 0.6 indicating the confidence level above which individuals contribute to the collective solution. The “contributors” replace the current collective solution by their own solution. Individuals who do not contribute (i.e., those with a confidence level lower than τ) leave the collective solution unchanged. (B) The resulting collective solution in the chain at each position. The blue open circles indicate a correct answer, and the red open circles indicate a wrong one. In this example, the individual at chain position 1 initialises the collective solution with a correct answer. The collective solution remains unchanged until the contributor at chain position 4 replaces it by a wrong answer. The individual at position 6 is also a contributor and restores the correct answer. All other individuals have no impact on the collective solution. In this example, the chain generates a correct solution.

