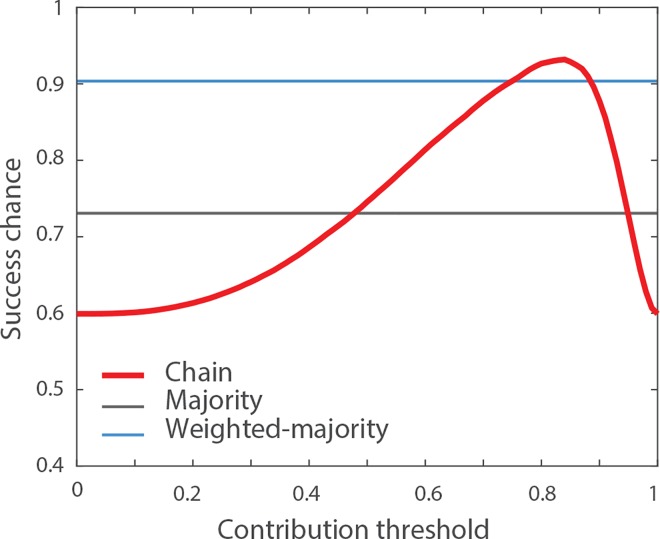
Fig 3. Impact of the contribution threshold τ.
The red line indicates the probability that the chain generates a correct solution for different values of the contribution threshold τ, assuming a group size of N = 10, a proportion of correct answers q1 = 0.6 and the confidence distributions shown in Fig 1. In these conditions, the optimal value for the contribution threshold is τ = 0.83, for which the chain produces the correct solution 93% of the time. The grey and blue lines indicate the success chances of the majority and the weighted-majority rules, respectively.

